
Five months after completing its acquisition of SanDisk, Western Digital is introducing SSDs under the WD brand for the consumer market. The WD Blue is the mainstream SATA offering and is derived from the SanDisk X400. While not exactly the first Western Digital SSD in blue, the WD Blue is the beginning of a new era for the WD brand and is an acknowledgment that SSDs are now mainstream consumer products that exist alongside or displace hard drives instead of just occupying a high-end niche.
The SanDisk X400 was announced at the beginning of this year as the new flagship of SanDisk’s business/OEM client SSD family. When we reviewed it in May we were pleasantly surprised to find that it raised the bar for the performance and power efficiency of planar TLC SSDs and was a credible mid-range drive, not just an entry-level budget-oriented product. The WD Blue SSD uses the same hardware platform as the SanDisk X400, but with some changes to the firmware. Most notably, the WD Blue reserves a bit more spare area and thus has capacities of 250GB, 500GB and 1000GB where the X400 has capacities of 128GB–1024GB. There are minor differences to the performance specifications and the WD Blue has only a three year warranty compared to the X400’s five years. (Though still better than the two year warranty carried by the current WD Blue hard drives.)
| Western Digital WD Blue Specifications | |||||
| Capacity | 250GB | 500GB | 1000GB | ||
| Form Factor | 2.5″ 7mm SATA or M.2 2280 SATA | ||||
| Controller | Marvell 88SS1074 | ||||
| NAND | SanDisk 15nm TLC | ||||
| Sequential Read | 540 MB/s | 545 MB/s | 545 MB/s | ||
| Sequential Write | 500 MB/s | 525 MB/s | 525 MB/s | ||
| 4KB Random Read | 97k IOPS | 100k IOPS | 100k IOPS | ||
| 4KB Random Write | 79k IOPS | 80k IOPS | 80k IOPS | ||
| Average Power | 70 mW | ||||
| Max Power | 4.4 W | ||||
| Encryption | No | ||||
| Endurance (TBW) | 100 TB | 200 TB | 400 TB | ||
| Warranty | Three years | ||||
| MSRP | $79.99 | $139.99 | $299.99 | ||
All capacities of the WD Blue are available in either the 2.5″ SATA form factor or as M.2 2280 cards. This continues the trend of recent mainstream SATA SSDs placing M.2 on an equal footing with the 2.5″ form factor.
As a result of the increased spare area, the WD Blue has a higher write endurance rating than the SanDisk X400 and one of the highest endurance ratings of any TLC SSD. It even exceeds the rating on some capacities of the Samsung 850 Pro that comes with a 10 year warranty. Western Digital is pitching the WD Blue as suitable for heavy workloads, and even if its performance falls short of the best SATA drives it should last a very long time even when subject to a write-intensive workload.
| SSD Endurance Specifications Comparison | |||||
| Capacity | 240-256GB | 480-512GB | 960-1024GB | ||
| WD Blue | 100 TBW | 200 TBW | 400 TBW | ||
| SanDisk X400 | 80 TBW | 160 TBW | 320 TBW | ||
| OCZ Trion 150 | 60 TBW | 120 TBW | 240 TBW | ||
| OCZ VX500 | 148 TBW | 296 TBW | 592 TBW | ||
| Samsung 850 EVO | 75 TBW | 150 TBW | 150 TBW | ||
| Samsung 850 Pro | 150 TBW | 300 TBW | 300 TBW | ||
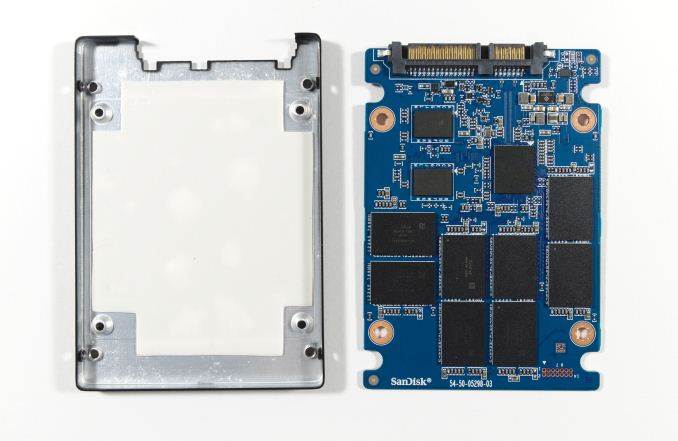
The construction of the WD Blue carries over the same metal case and plastic lid that SanDisk has been using for years. Inside our 1TB sample we find the same single-sided PCB as in the X400 and the thermal pad that covers nearly every component. The NAND is arranged in eight packages of 128GB each, while the Micron DRAM is split across two packages.


For this review the 1TB WD Blue will be compared against most of the other 1TB-class SATA drives we have tested. The current competition in the marketplace consists primarily of the preceding SanDisk X400, cheaper planar TLC SSDs such as the OCZ Trion 150, MLC SSDs that are mostly significantly more expensive, and 3D TLC SSDs such as the Samsung 850 EVO and Crucial MX300. Note that while we have already reviewed the 750GB Crucial MX300, in this review we are comparing against the 1050GB MX300 that will be covered by an upcoming review of the wider range of MX300 capacities that are now available.
| AnandTech 2015 SSD Test System | |
| CPU | Intel Core i7-4770K running at 3.5GHz (Turbo & EIST enabled, C-states disabled) |
| Motherboard | ASUS Z97 Pro (BIOS 2701) |
| Chipset | Intel Z97 |
| Memory | Corsair Vengeance DDR3-1866 2x8GB (9-10-9-27 2T) |
| Graphics | Intel HD Graphics 4600 |
| Desktop Resolution | 1920 x 1200 |
| OS | Windows 8.1 x64 |
- Thanks to Intel for the Core i7-4770K CPU
- Thanks to ASUS for the Z97 Deluxe motherboard
- Thanks to Corsair for the Vengeance 16GB DDR3-1866 DRAM kit, RM750 power supply, Carbide 200R case, and Hydro H60 CPU cooler
Our performance consistency test explores the extent to which a drive can reliably sustain performance during a long-duration random write test. Specifications for consumer drives typically list peak performance numbers only attainable in ideal conditions. The performance in a worst-case scenario can be drastically different as over the course of a long test drives can run out of spare area, have to start performing garbage collection, and sometimes even reach power or thermal limits.
In addition to an overall decline in performance, a long test can show patterns in how performance varies on shorter timescales. Some drives will exhibit very little variance in performance from second to second, while others will show massive drops in performance during each garbage collection cycle but otherwise maintain good performance, and others show constantly wide variance. If a drive periodically slows to hard drive levels of performance, it may feel slow to use even if its overall average performance is very high.
To maximally stress the drive’s controller and force it to perform garbage collection and wear leveling, this test conducts 4kB random writes with a queue depth of 32. The drive is filled before the start of the test, and the test duration is one hour. Any spare area will be exhausted early in the test and by the end of the hour even the largest drives with the most overprovisioning will have reached a steady state. We use the last 400 seconds of the test to score the drive both on steady-state average writes per second and on its performance divided by the standard deviation.
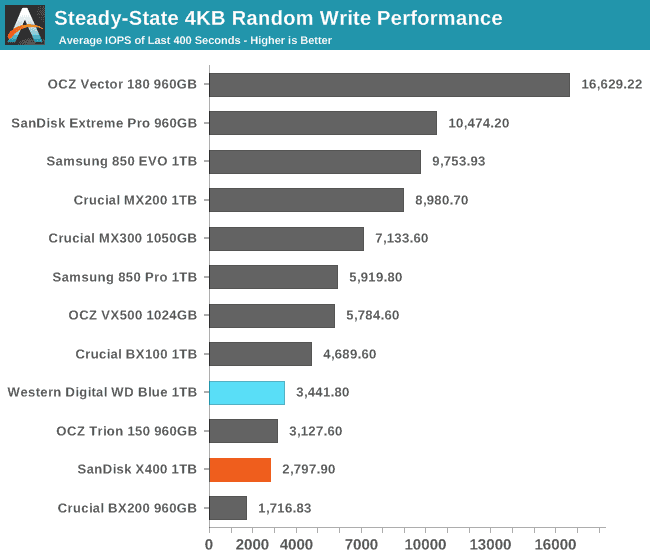
With a slight increase in out of the box overprovisioning, it is unsurprising to see the WD Blue improve on the SanDisk X400’s steady-state random write performance. The WD Blue overtakes the OCZ Trion 150 as the fastest planar TLC NAND SSD, but doesn’t catch up to the MLC or 3D TLC drives.
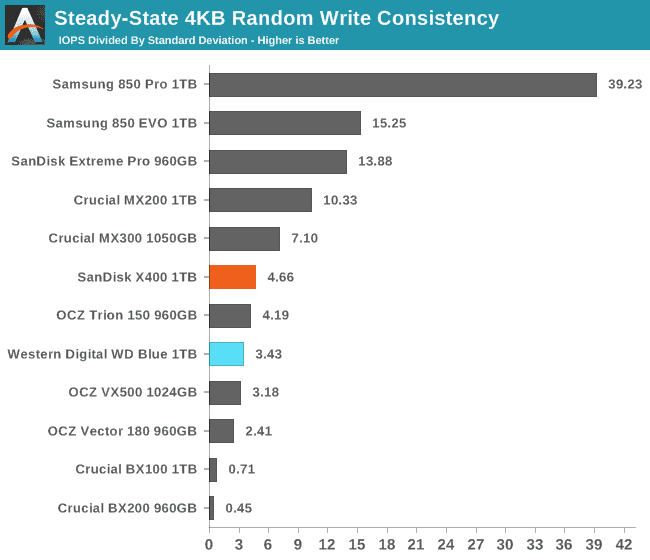
The WD Blue has slightly worse performance consistency than the X400, but not low enough to be cause for concern.
 |
|||||||||
| Default | |||||||||
| 25% Over-Provisioning | |||||||||
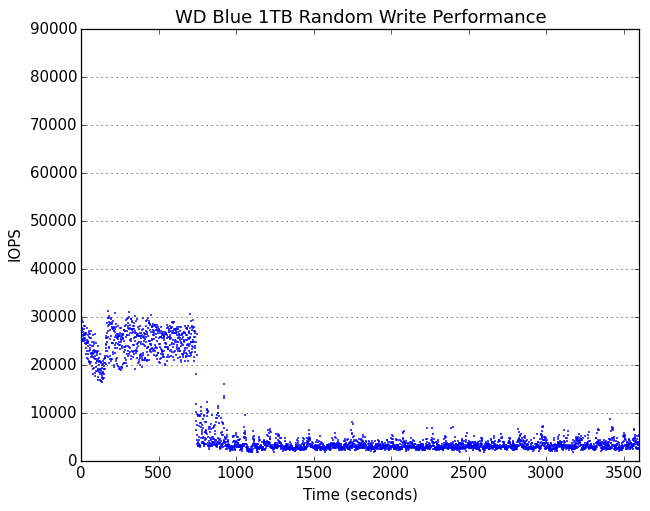
Before reaching steady state, the WD Blue hovers between 20k and 30k IOPS, a significant improvement over the X400. Several other competitors have higher peak performance, but are either less consistent during the early phase of the test or don’t last as long before dropping to steady state.
 |
|||||||||
| Default | |||||||||
| 25% Over-Provisioning | |||||||||
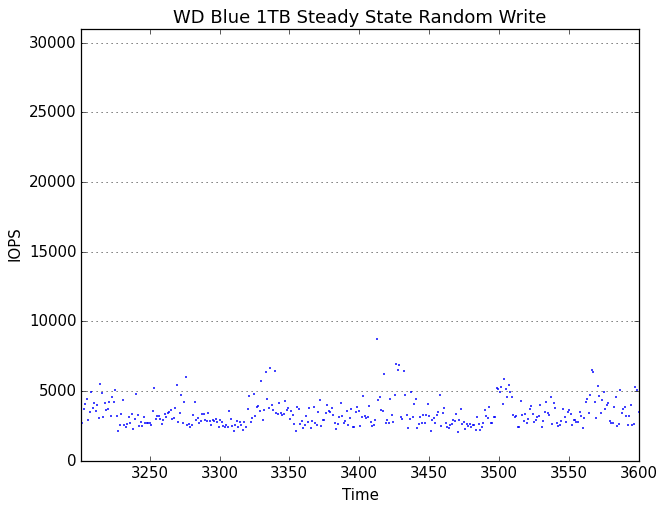
Upon reaching steady state, the WD Blue varies from roughly 2500 IOPS to 5000 IOPS, with short bursts of slightly higher performance. With extra overprovisioning the base performance of the WD Blue doesn’t change but the upper limit of its normal band of performance increases to around 10k IOPS and the peaks reach 25k.
The Destroyer is an extremely long test replicating the access patterns of very IO-intensive desktop usage. A detailed breakdown can be found in this article. Like real-world usage and unlike our Iometer tests, the drives do get the occasional break that allows for some background garbage collection and flushing caches, but those idle times are limited to 25ms so that it doesn’t take all week to run the test.
We quantify performance on this test by reporting the drive’s average data throughput, a few data points about its latency, and the total energy used by the drive over the course of the test.
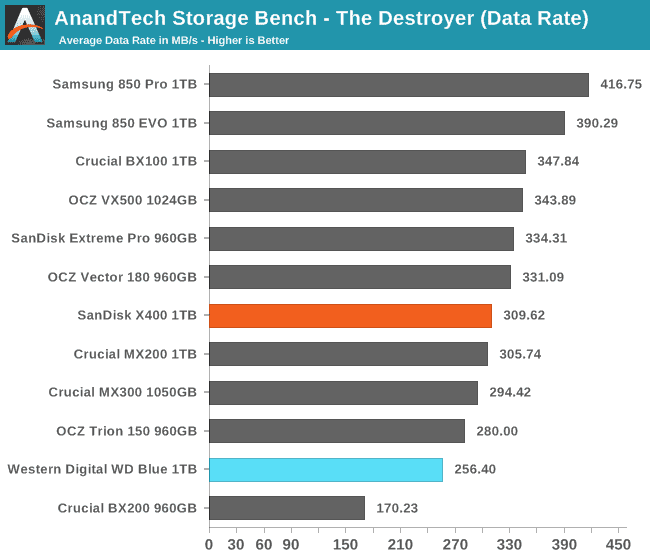
The WD Blue fails to keep up with the competition on The Destroyer, trailing behind everything except the Crucial BX200. Where the SanDisk X400 was one of the fastest TLC SSDs, the WD Blue is merely acceptable.
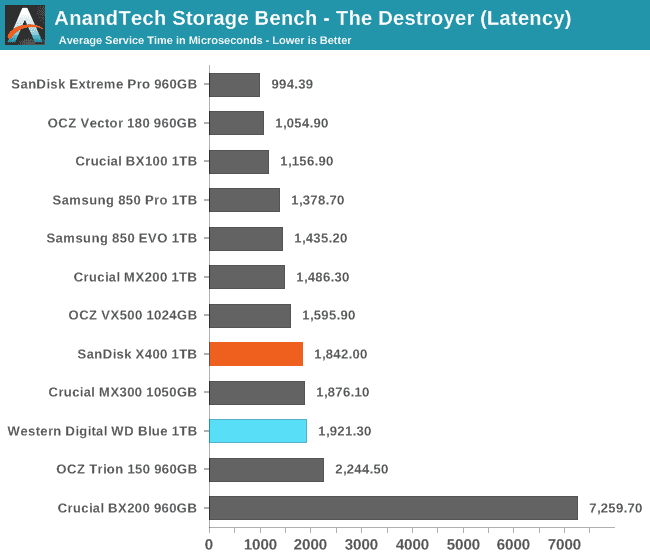
The average service time of the WD Blue is only slightly worse than the SanDisk X400, and still clearly better than the OCZ Trion 150. This suggests that the WD Blue’s lower average data rate is due to it being uniformly a bit slower, and that it isn’t experiencing any severe stalling.
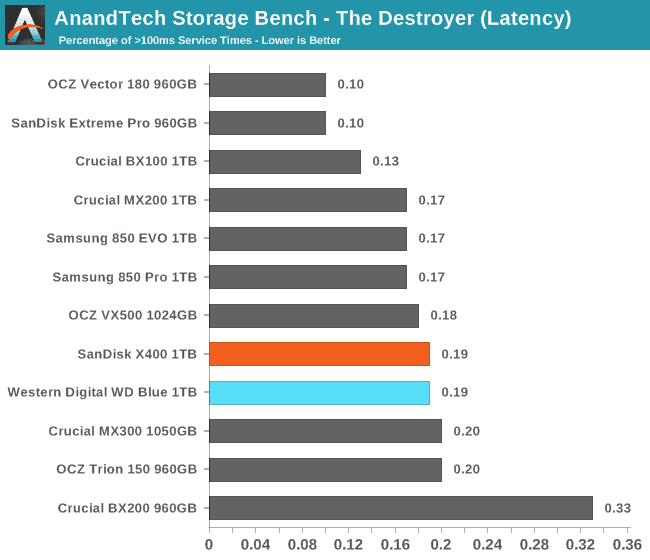
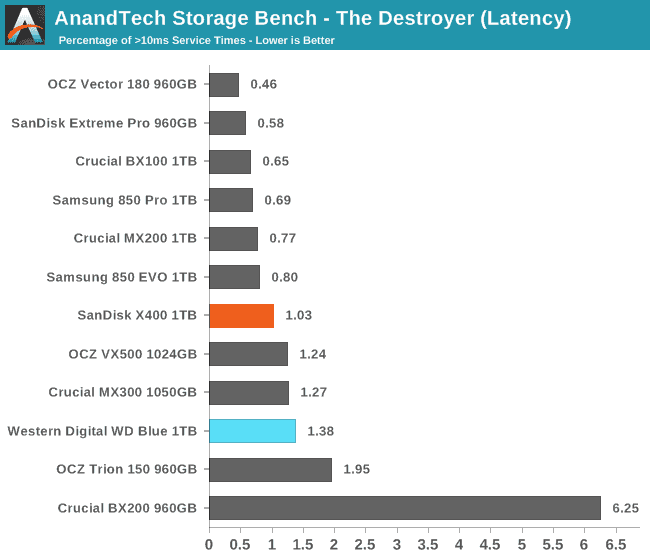
The WD Blue does not suffer from any more high-latency outliers than other TLC drives at the 100ms threshold, but at the 10ms threshold it is worse than average where the X400 exceeded expectations.
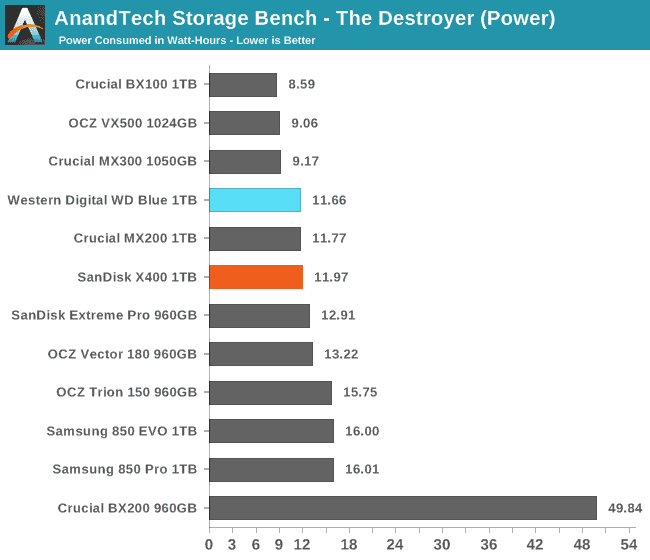
The WD Blue thankfully shows no regression in power efficiency and falls in the second tier of drives with energy usage, on par with the SanDisk X400.
Our Heavy storage benchmark is proportionally more write-heavy than The Destroyer, but much shorter overall. The total writes in the Heavy test aren’t enough to fill the drive, so performance never drops down to steady state. This test is far more representative of a power user’s day to day usage, and is heavily influenced by the drive’s peak performance. The Heavy workload test details can be found here.
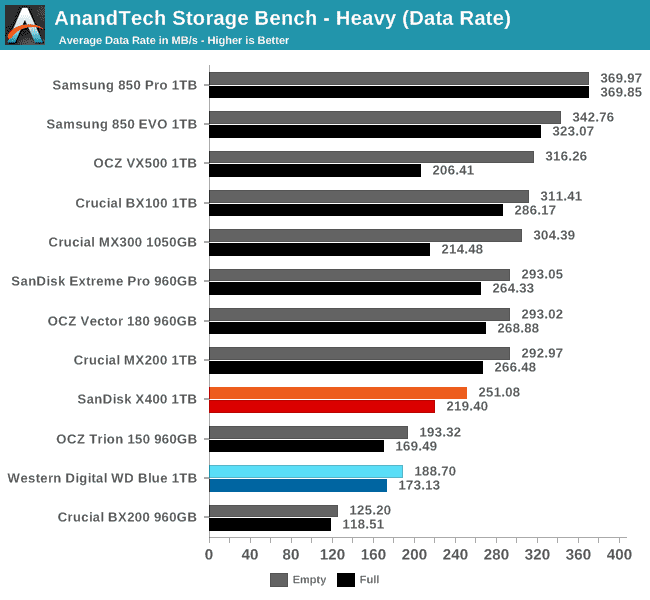
The WD Blue is tied with the OCZ Trion 150 for average data rate on the Heavy test, where the SanDisk X400 had a substantial advantage that put it close to MLC drives.
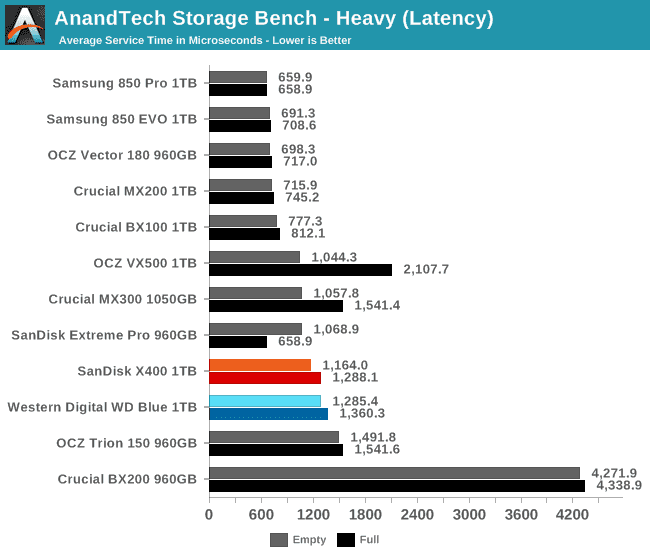
As with The Destroyer, the WD Blue only has slightly higher average latency than the X400 and is not as slow as the Trion 150. Additionally, the average latency on a full drive beats competitors like the OCZ VX500 and Crucial MX300 that suffer disproportionately when their SLC caches are exhausted.
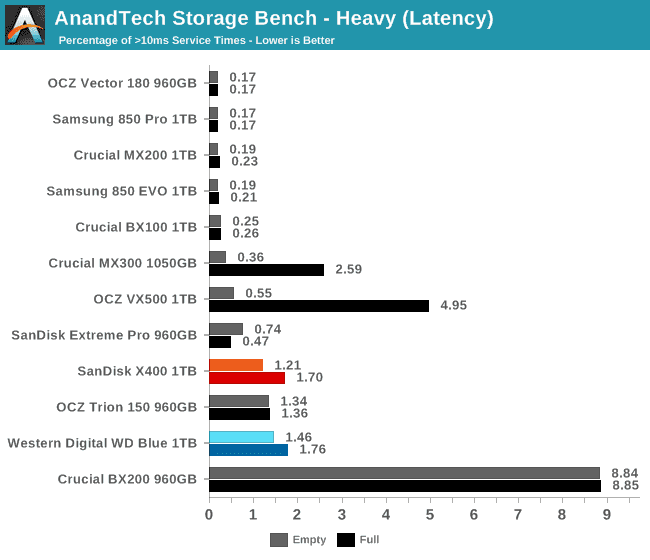
The number of high-latency outliers makes it obvious that the WD Blue is a TLC drive, but also makes it clear that the drive degrades gracefully under a heavier load rather than falling apart.
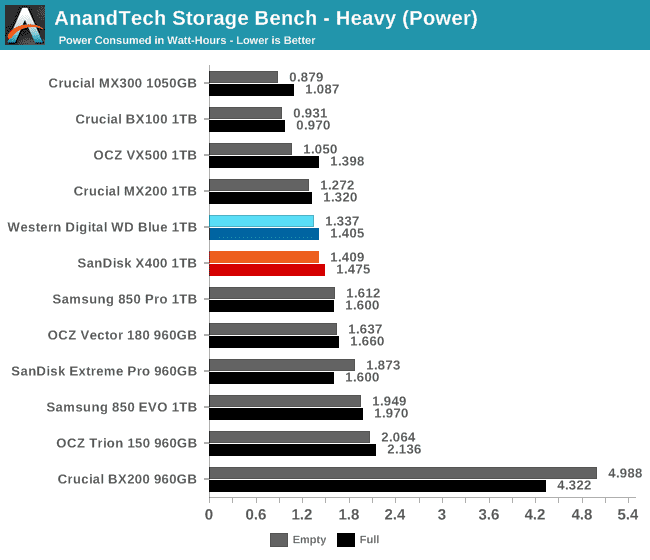
The WD Blue is slightly more power efficient on the Heavy test than the X400, and both drives…


