Sales of SSDs in the first quarter of 2016 were up 41.2% year-over-year, based on findings from TrendFocus*, a storage market tracking company. Shipments of all types of SSDs, including drives for client and server systems, were up sequentially and year-over-year, which again proves that NAND-based storage devices are taking the place of traditional hard drives both inside client PCs and enterprise machines.
SSD Sales now above 33.7 Million Units
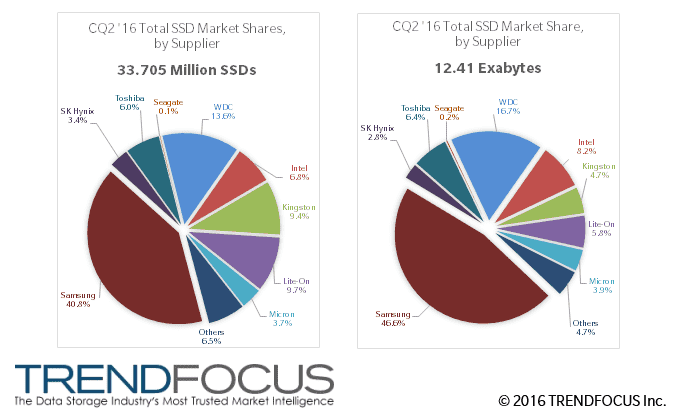
Shipments of SSDs in the second quarter hit 33.705 million units, which is nearly 10 million units higher than in the same period a year ago and up 9.5% from the previous quarter, according to TrendFocus. According to IDC and Gartner, sales of PCs were also relatively strong in Q2 compared to Q1: the industry sold 62.4-64.3m units, which is flat or slightly up (depending on who you take numbers from). Meanwhile, the SSD market for client PCs and servers has been growing rapidly for many quarters, therefore, and all-time high shipment units in Q2 came as no surprise.
| SSD Market at Glance in Q2 2016 Data by TrendFocus All numbers are millions of units, Exabytes or Gigabytes |
||||||||||
| Form-Factor (Units) |
Interface (Units) |
Total | Average Capacity |
|||||||
| Drives 2.5″/3.5″ |
Modules mSATA/M.2 |
SATA | SAS | PCIe | Units | Exabytes | ||||
| Client | 16.637 | 13.0 | ? | ? | ? | 29.637 | 8.24 | 278 GB | ||
| Enterprise | 3.868 | 0.2 | 3.2 | 0.668 | 0.2 | 4.068 | 4.17 | 1025 GB | ||
| Total | 20.505 | 13.2 | 3.2 | 0.668 | 0.2 | 33.705 | 12.41 | 368 GB | ||
There are multiple industrial trends that help to accelerate adoption of SSDs by both client PCs as well as servers:
Firstly, price. Entry-level SSDs are getting cheaper thanks to rapid per-GB price declines of TLC and 3D TLC NAND flash memory. This is combined through competition among vendors as well as the adoption of multiple module form-factors. In the second quarter, average contract prices of 128 and 256 GB SSDs dropped to $37.20 and $60.80 per unit, respectively, according to DRAMeXchange. For example, 120/128 GB SSDs for $35-$38 are easy to find at Amazon. Moreover, there are plenty of drives with 240 GB or 256 GB capacities that cost less than $60 at Amazon.
Secondly, rapid performance improvements brought by NVMe protocol and new controllers supporting PCIe 3.0 bus stimulate strong demand for newer SSDs by enthusiasts and boutique PC makers.
Thirdly, new technologies (3D NAND, stacking, etc.) enable companies like Samsung and Toshiba to build SSDs that challenge HDDs not only in terms of performance but also in terms of capacities, thus stimulating demand from datacenters.

Average SSD Capacity Hits 368 GB
The total capacity of all SSDs sold in the second quarter achieved 12.47 Exabytes, up 93% year-over-year and 24.1% quarter-over-quarter, based on estimations from TrendFocus. The company believes that the whole industry produced 29 EB of NAND flash (up 17% sequentially) and SSDs consumed 42.5% of that output. The major increase of NAND flash bit supply was driven by the ramp up of 3D NAND and TLC NAND memory by leading manufacturers. This is due to the growing demand for non-volatile storage from many applications and industries. While this fast growth of NAND supply looks impressive, several industry insiders are indicating that demand is outpacing supply, which would drive up prices. However larger chips help mitigate this issue, keeping cost/GB down.
Meanwhile, the average capacity of an SSD, combining consumer and enterprise, increased such that:
– 325 GB to 368 GB from Q1 2016 (a 13.2% QoQ growth) and,
– 268 GB to 368 GB from Q2 2015 (a 37.3% YoY growth)
The recent declines of NAND flash memory pricing made SSDs with 240/256 GB and higher capacities considerably more popular than they were a year ago in the PC segment, driving average client SSD capacity to 278 GB. Moreover, companies like Samsung and Toshiba introduced enterprise-class SSDs that can store 8 TB or even 15 TB of data, which helped average capacity of a datacenter-class SSD to increase to just over 1 TB for the first time in Q2 2016.
| Average Capacities of SSDs by Top Manufacturers in Q2 2016 Data by TrendFocus |
|||||
| Q2 2016 (av GB per unit) |
Q1 2016 (av GB per unit) |
Q2 2015 (av GB per unit) |
|||
| Intel | 445.4 | 288.0 | 331.6 | ||
| Kingston | 183.0 | 185.3 | 141.2 | ||
| Lite-On | 220.2 | 229.2 | 255.3 | ||
| Micron | 384.0 | 398.6 | 396.8 | ||
| Samsung | 420.4 | 360.2 | 283.3 | ||
| SanDisk/Western Digital | 452.0 | 227.4 | 243.2 | ||
| SK Hynix | 304.3 | 231.5 | 231.9 | ||
| Toshiba | 391.1 | 282.4 | 252.7 | ||
| Others | 264.8 | 281.2 | 164.6 | ||
| Overall | 368.2 GB/unit | 324.9 GB/unit | 268.2 GB/unit | ||
Strong demand for high-capacity datacenter-class SSDs in the recent quarters, as well as shift for high-end models, has helped a number of companies increase the average SSD capacity per unit of their sales significantly in the second quarter both sequentially and year-over-year (the combination of HGST and SanDisk shipments under Western Digital brand somewhat distorts the picture, but it still is in line with general trends). Meanwhile, short supply of NAND and focus on unit sales triggered declines of average SSD capacities for companies like Kingston, Lite-On and some others.
Samsung Retains Leadership Amid Slight Drop of Unit Sales
Samsung controlled about 36.3% of the global NAND flash production in Q2 2016 based on revenue, according to DRAMeXchange. Moreover, its NAND bit shipments were up 15% sequentially, the same company reports. Nonetheless, when it comes to SSDs, the quarter was a mixed bag for the company.

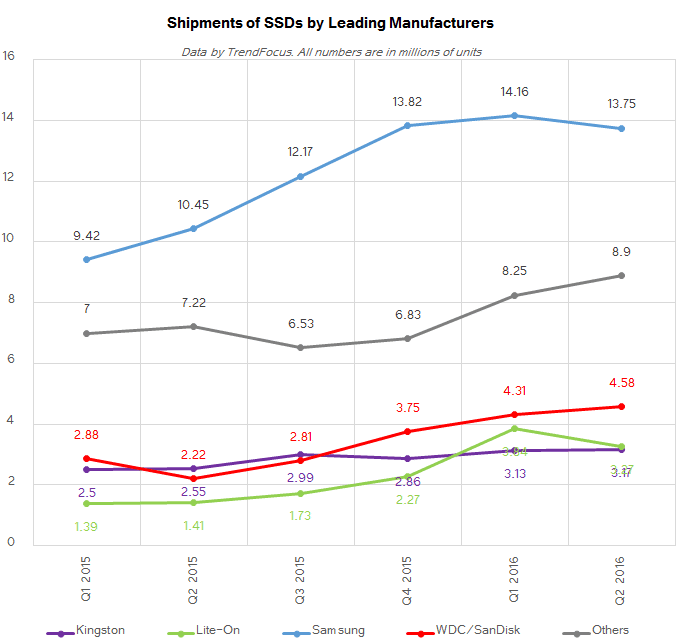
Sales of Samsung SSDs in Q2 totaled 13.75 million units, up from 10.45 million in the same period a year before (an increase of 31.5%), but slightly down from 14.16 million units in Q1 (a decrease of 2.9%). Meanwhile, the total capacity of Samsung’s SSDs in the second quarter increased to 5.78 EB, up from 2.96 EB in Q2 2015 (up 51.2%, slower than the industry) and 5.1 EB in Q1 2016 (+12%, slower than the industry).
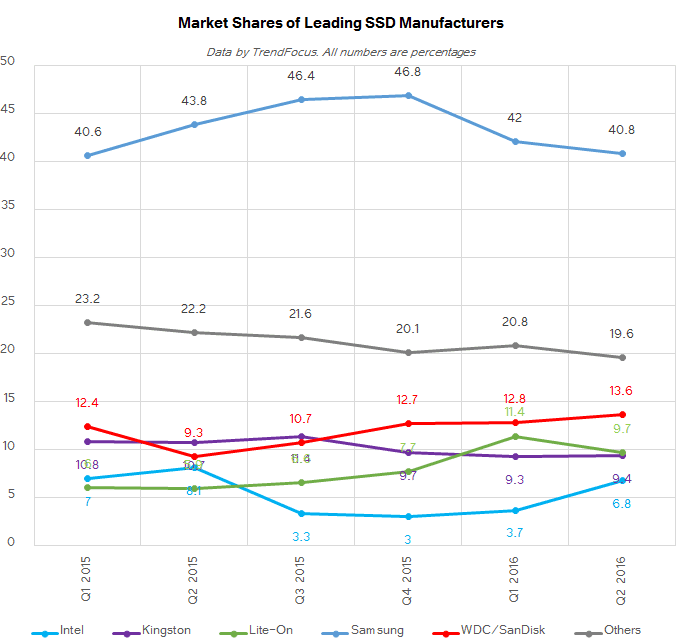
Due to a slight drop in unit sales, Samsung’s market share decreased to 40.2%. While the company is still well ahead of everyone else, its SSD unit shipments and market share have been decreasing for two straight quarters now. The reasons for that are more or less clear: the company is gradually increasing average capacities of its SSDs, boosting their average selling prices (average capacity of a Samsung SSD in Q2 was 420 GB), but the amount of NAND flash it can use for SSDs seems to be somewhat limited (we will discuss this issue below). As a result, Samsung focuses on more lucrative high-capacity drives, sacrificing market share and unit shipments for higher per-unit selling prices.

Western Digital’s SanDisk retained #2 position in the SSD market for Q2: it shipped 4.58 million drives (up 106% YoY and 6.2% QoQ) and increased its market share to 13.6% in Q2 2016. What is even more important is that the company doubled the amount of NAND flash memory it used for its SSDs from the previous quarter (2.07 EB vs 0.98 EB) and nearly quadrupled it from the same period a year ago (0.54 EB). The average capacity of a SanDisk SSD in the second quarter was 452 GB, according to TrendFocus, the highest in the industry. Despite the fact that SanDisk lost a part of its OEM SSD business lately, its performance on the SSD market in the recent quarters was rather impressive.
Important notice: When analyzing historical data for SanDisk, keep in mind that starting from the second quarter of 2016 sales of SanDisk and HGST are combined under the Western Digital name. HGST does not sell a lot of drives (in 1H 2015 it controlled roughly 1.0%-2.6% of the global SSD market, so its shipments were 200-600 thousand units per quarter at best), but it sells a lot of high-end high-capacity SAS SSDs. Therefore, the addition of HGST’s product mix to SanDisk’s has a strong impact on average SSD capacities of Western Digital.
Lite-On, which sells SSDs under Lite-On and Plextor trademarks, maintained its third place in the rankings of SSD makers with 9.7% market share, based on data from TrendFocus. The company sold 3.27 million drives (up 131% YoY, but down 14.9% QoQ) with a total capacity of 0.72 EB (up 100% YoY, but down 19% QoQ). Since Lite-On only serves the client PC market, the average capacity of its SSDs was 220 GB, down both sequentially and year-over-year. This happened because in the recent quarters Lite-On introduced a number of inexpensive drives (particularly, under its Plextor brand), which attracted consumers with budget constraints that typically focus on smaller drives anyway. One of the reasons why Lite-On released such Plextor drives was timing (the M8Pe-series high-end SSDs are hitting the market only now), but another was the short supply of NAND in general. As a result, the company managed to increase its unit sales, but at the cost of average capacities and ASPs.
Kingston managed to boost its SSD shipments slightly to 3.17 million units (up 24.3% YoY and 1.2% QoQ) in the second quarter and increased its market share to 9.4%. Its total data (exabyte) shipments remained flat sequentially but are +61% compared to the same period a year ago. Since Kingston serves the entry-level segment of the client PC market, the average capacity of its SSDs is among the lowest in the industry at ~183 GB.
Intel’s positions as a supplier of SSDs has not been particularly strong in recent quarters, but in Q2 2016 the company managed to increase sales of its SSDs to 2.29 million units (up 18.6% YoY and 83% QoQ) and overtook Micron and Toshiba. The total capacity of Intel’s SSDs shipped in the second quarter was around 1.02 EB, a 59% growth over the same period a year ago and 183% more than in the previous quarter. The…


